What is Binance Futures Smart Signal? Who counts as Smart Money, how to read dominant flow, and why beginners shouldn't trade off it
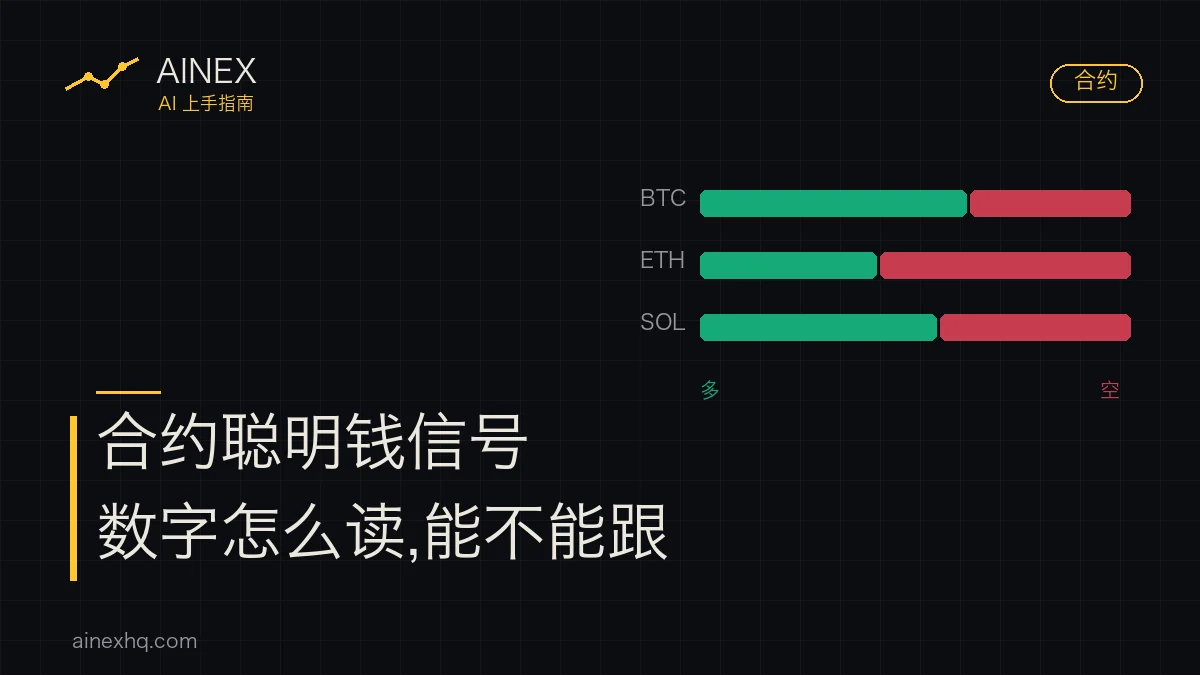
Dominant flow: long. In Binance Futures' [Smart Signal], a contract card shows that direction, with the number of Smart Money users and the long/short split right next to it; tap through and you also get the average entry price and the share of traders in profit. The thought arrives almost on its own: the pros are all going long, so if I follow them, surely I'm safe? Once you work out who this tool is actually counting and where each number comes from, it turns out to be useful as data, but not as a buy or sell signal.
Who gets marked as Smart Money
Binance's Help Center article "How to Use Binance Futures Smart Signal?" sets out the criteria. For all USDⓈ-M futures users, an account that meets either of these conditions is marked as a Smart Money user:
- PNL over the last 30 days above 1,000 USD and no more than 100,000 USD, a 30-day ROI of at least 50%, and a positive total PNL;
- PNL over the last 30 days above 100,000 USD, and a positive total PNL.
Among those Smart Money users, anyone with a last-30-day PNL above 100,000 USD and a positive total PNL is further marked as a whale user. The page also notes: "The whales are also included in the traders data."
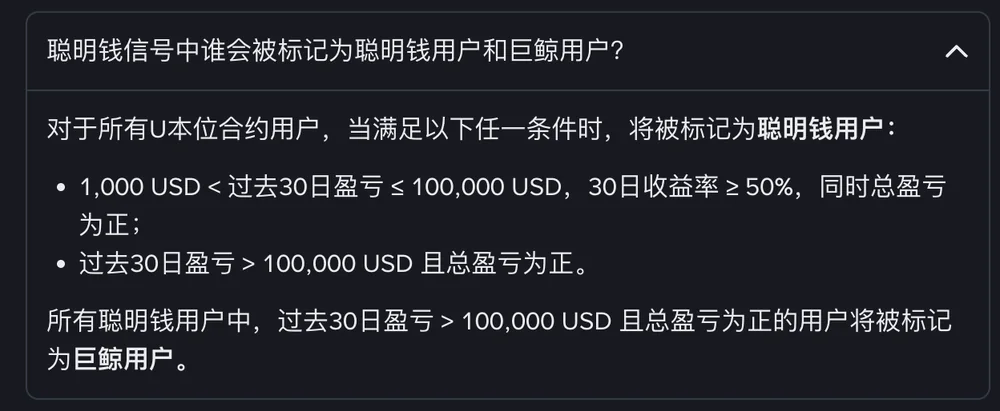
These conditions have one thing in common: every one of them looks at profit and loss that has already happened. 30-day PNL, 30-day ROI, total PNL: all outcomes. The PNL and ROI figures only cover the last 30 days, so they describe the past month, not a long track record. Picking people by outcome has survivorship bias built in, because accounts that did the same thing and lost money never make the list. The name Smart Money really means "made money recently," not "will be right next time."
Worth knowing: the page offers no statistics on how Smart Money users perform afterwards, and it never says that following their direction makes money. What it claims for the tool is that it "may help you to make more informed decisions for your trading." The decision, and the risk, stay with you.
Dominant flow, dominant position, and the [B] on the card
Smart Signal can be switched between time ranges, and what "dominant" refers to changes with the option you pick:
- Pick [30m], [1h], [24h] or [7D]: you see dominant flow, the side (long or short) where Smart Money users traded more volume over that period. The system calculates each contract's net position for the period; when net long volume is higher than net short volume, the contract card shows [B] together with the position notional for that side.
- Pick [All]: you see dominant position, the side with the higher notional value among the positions Smart Money users currently hold.
So on the same contract, [24h] tells you which side Smart Money users traded more volume on over that day, while [All] tells you which side carries more notional value in the positions they hold right now. The two can disagree. Before you read anything, check which time range you have selected.
What the numbers on the overview and detail pages mean
Each contract card on the overview page shows: the number of Smart Money users who opened a position on that contract during the selected period; the dominant flow or dominant position (long or short); the long/short distribution, plus how many Smart Money users are on the dominant side; and the notional value of positions newly opened during the selected period.
Let's read one card item by item. The field names follow the Help Center, every number is made up, and the time range is set to [24h]:
- Smart Money users: 120. 120 Smart Money users opened a position on this contract during the selected 24 hours.
- Dominant flow: long, with [B] on the card. Over these 24 hours, Smart Money users' net long volume on this contract was higher than their net short volume; the number next to [B] is the position notional on the long side.
- Long/short distribution, users on the dominant side: 50. Of the 120, 50 are on the long side, fewer than half. Dominant flow is measured by volume, not by headcount, so you can get "the flow is long, yet fewer than half of them are long": a handful of accounts trading big size is enough to pull dominant flow over to the long side.
- Notional value of new positions: 3 million. This is the notional value of positions newly opened in the selected 24 hours, not the total that Smart Money users hold. For total position notional, you have to open the detail page.
Open a contract's detail page and you get more:
- the total position notional on that contract for the selected period, and the number of Smart Money users who have an open position on it;
- the contract's current long/short ratio;
- for the long side and the short side separately: number of Smart Money users, position value, average entry price, unrealized PNL, and the share of traders in profit;
- a details list: net volume details when a time range is selected, and current position notional details when [All] is selected.
If a Smart Money user has shared their positions, you can tap through to their Smart Money profile to look at them, and switching between [Traders] and [Whales] gives you the position overview for each group.
Where to find it
- App: go to [Futures] - [Smart Money] - [Smart Signal] and choose a time range and a contract. Tap [View] for the details, including total positions, total traders and the long/short ratio.
- Website: go to [Futures] - [Smart Money] - [Smart Signal], filter by time range and contract, and click a contract card for the details.
The page points out one more difference: with a time range selected, the list is based on each contract's net position; with [All] selected, it is based on current positions.
What these numbers can't tell you
Go through every item the page lists and a few questions stand out that this tool simply can't answer:
- You can't see the whole of any one person's trading. The overview and detail pages show totals, averages and percentages across a group of Smart Money users. Whether someone's long is part of a bigger plan or a hedge, and how much of their capital it represents, can't be read from anything the page lists.
- Their average entry price is not your entry price. The average entry on the long side may sit well below the current price. A position that shows them a paper profit is a different trade altogether if you enter it now.
- You can't see when they'll get out. The page gives you data on what has already happened, such as positions, net volume and unrealized PNL. It won't warn you ahead of time who is about to close.
How to think about it: if all you want is a sense of what a slice of accounts is doing, reading it as a position summary for a group of people who made money recently is enough. Just don't treat it as an order button. The same applies when you ask AI to interpret these numbers: our neutral test of whether AI can help beginners pick coins and spot risk concluded that it's good at explaining and poor at predicting.
Three things to settle before a beginner opens this tool
- Should you be touching futures at all right now? Smart Signal lives in the futures section, and the positions it tracks are leveraged. If you can't yet tell isolated margin from cross margin, don't open your first futures position just because the pros are all long.
- You can call the direction right and still get liquidated. Your position size and how close you are to your liquidation price matter just as much. Even if you decide to trade futures later, start with the position size calculator to work out how large a position your capital and per-trade risk can support, and use the risk-reward calculator to set your stop-loss and take-profit.
- Don't outsource the decision. Smart Signal, AI, a self-styled guru in a group chat: all of it is reference material and nothing more. For how far a tool can actually go in watching the market and placing orders for you, see our look at the limits of letting GPT-5.6 watch the market and trade for you.
The questions people ask most
If an account is marked as Smart Money, will it keep making money?
The label says nothing about the future. It is assigned based on last-30-day PNL, 30-day ROI and whether total PNL is positive, all of which are results that have already happened. Treat it as a filter for "this group made money recently," not as a judgment about what comes next.
What does the [B] on a contract card mean?
When you pick [30m], [1h], [24h] or [7D], the system calculates Smart Money users' net position on each contract over that period; when net long volume is higher than net short volume, the contract card shows [B] along with the position notional for that side.
What's the difference between whales and traders?
Whales are a subset of Smart Money users: anyone whose last-30-day PNL is above 100,000 USD and whose total PNL is positive gets marked as a whale. The page also states that "the whales are also included in the traders data," which means whales are part of the traders group, not a separate crowd.
Can a beginner place futures orders by following Smart Money's long/short direction?
It's not a good idea. What the page gives you is the combined direction, average entry price and unrealized PNL of a group of accounts, not any one person's complete trade. Futures are leveraged, so you can follow the right direction and still get liquidated because your position is too large. Use the position size calculator first to work out how large a position you can handle, and only then think about whether to open a futures trade at all.
Keep reading
Can AI help beginners pick coins and spot risk?
Explaining something clearly isn't the same as judging it right.
Position / risk calculator
Size the position from your capital and per-trade risk.
Can GPT-5.6 watch the market and trade for you?
A tool can help you look. It can't take the risk for you.